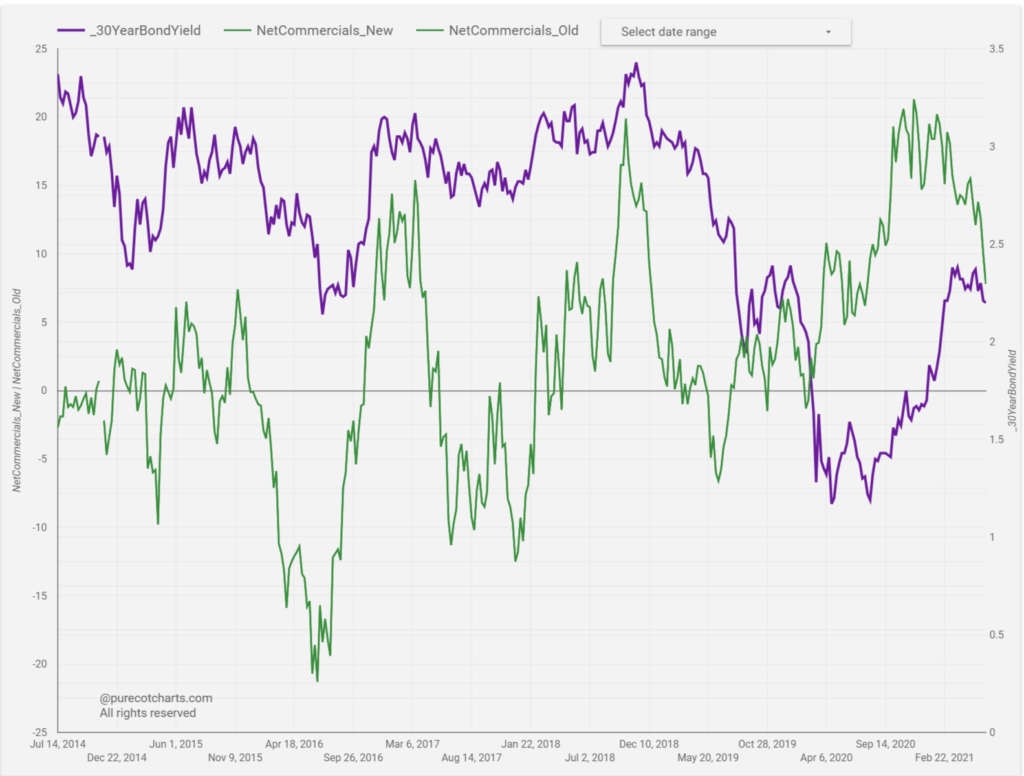
Visualize market turning points from algorithmically transformed CFTC Commitment of Traders data
Our charts focus on net commercial trader activity because commercial traders are historically the most accurate at market turning points. However; because open interest generally increases over time, comparing raw activity time series numbers can provide a misleading picture. We solve this issue by algorithmically transforming commercial trader activity to a scale of -100 to +100 making it directly comparable across time. This is a unique feature and considerable value add our site provides.
Besides this, our charts provide a convenient sub-period zoom feature, accompanying tabular data for all charts and coverage of 47 different markets across 8 asset classes. We also have a blog where we provide insights on single instruments from time to time. Finally, we provide complimentary access to the CFTC Commitment of Traders reports synced with the Friday releases for site visitors. These are organized into easy to read and downloadable tables as a giveback to the community of traders that are interested in positional analysis using CoT reports.
Sample Chart – 30 Year US T Bond

